The right set of metrics is the final chord in your strategic workforce planning guide. Which ones will bring the actionable insights in your workforce planning? How do you measure them, and why?
The right set of metrics is the final chord in your strategic workforce planning guide. Which ones will bring the actionable insights in your workforce planning? How do you measure them, and why?
In this guide, we'll uncover these questions and much more. Read on!
Types of Strategic Workforce Planning Metrics
Strategic workforce planning (SWP) is a holistic approach to all your HR processes. With the proper planning, you can assess the current workforce state and encompass just the right number of people and skill sets to fulfill your business needs in the future. Consider the metrics below to check in with your SWP strategy and ensure you follow this strategy right.
For our readers’ convenience, we decided to break down the strategic workforce planning metrics into categories:
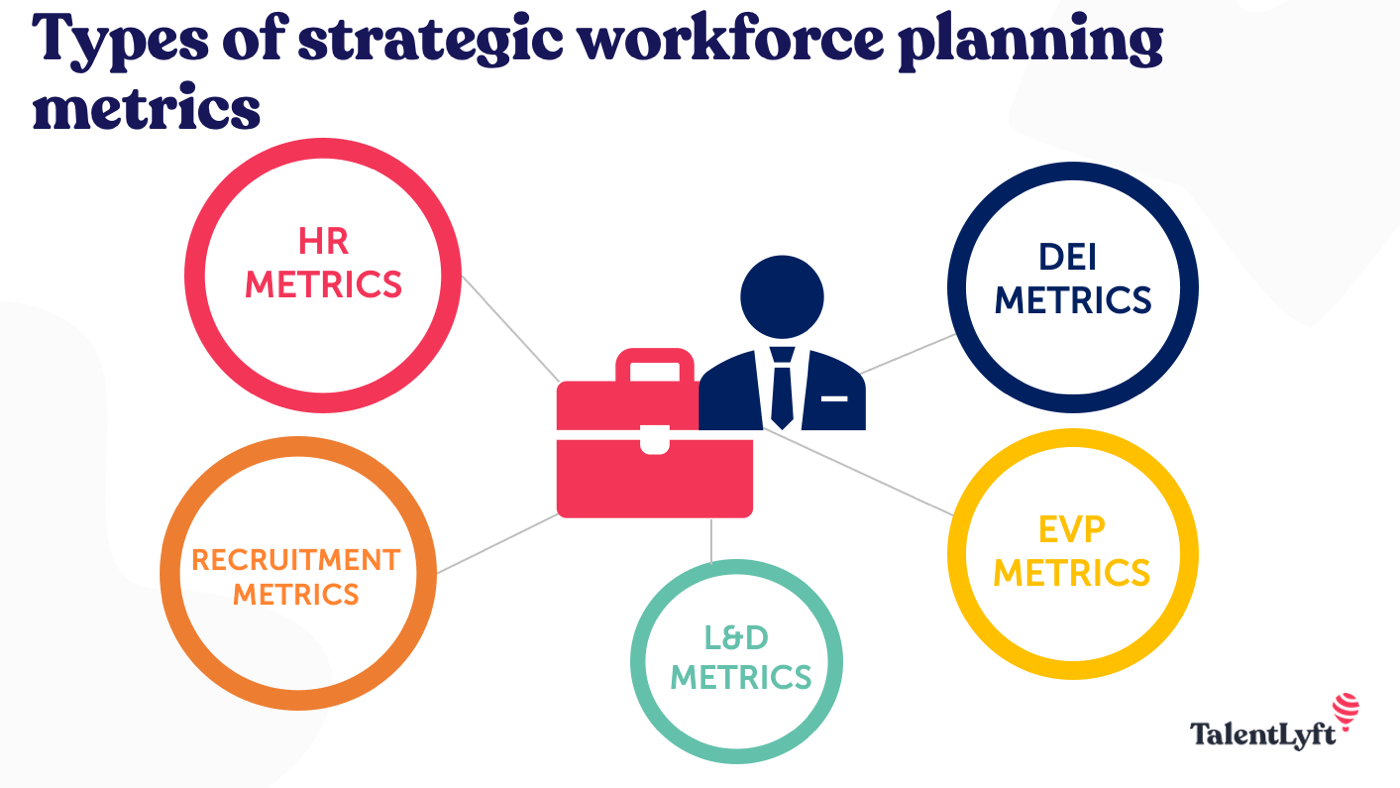
Now let's see them in detail.
HR metrics help organizations track essential data like employee productivity, engagement, and turnover. In a strategic workforce planning paradigm, HR metrics allow you to find sweet spots and bottlenecks that prevent your company from further growth and achieving business objectives.
This metric is unambiguous. It represents the overall number of employees working for your company.
Employee attrition and turnover go hand in hand, but there's a slight difference between these concepts.
The attrition rate means the loss of employees due to voluntary reasons and as a part of a natural process that you don't replace after they leave:
When to measure: At least once a year
How to measure: Voluntary lay-offs (due to reasons described above) / Overall number of employees at the beginning of the measured period * 100
A turnover rate represents the general number of people who leave a company at the employer's initiative. Different factors influence high turnover rates: from toxic company culture to lack of employee diligence. Anyways, you replace the laid-off employees with the other ones. That's how turnover differs from attrition.
When to measure: At least once per quarter
How to measure: General number of lay-offs/ Overall number of employees at the beginning of the measured period * 100
Every HR's dream is to keep their retention rates high. A high retention rate demonstrates the company's readiness to allocate critical human resources in the right positions and grow further.
When to measure: At least once per year
How to measure: Number of retained employees in a specified period / Overall number of employees * 100
Absenteeism means the number of working days employees spend outside the workplace without reasonable excuses or even not showing off. A high absenteeism rate signals issues with work discipline, low team morale, and lack of motivation.
When to measure: At least once per year
How to measure: Number of unexcused absences / Specified period * 100
Lateral movements within the company are becoming the primary type of career development. The career path ratio represents the ratio of promotions and lateral movements of employees.
A positive indicator is four lateral movements per promotion (0.2 or less). Watch out if your career path ratio ranges from 0.5 to 1.0, as it indicates issues with employee development. Usually, it happens because top management won't let their talented employees leave their departments and hinder their professional growth.
In addition, a career path helps you evaluate your internal mobility and readiness for filling in new positions with internal talents.
Tenure rate is also called employee lifetime value. It’s an essential strategic workforce planning metric that indicates the average time employees stay within an organization.
While the retention rate measures the average number of people who stay with a company for a specific period, the tenure rate measures the time period.
When to measure: At least once per year
How to measure: Overall number of days each employee has worked for a company / Headcount * 100
This metric provides insight into types of employment status like full-time, part-time, contractors, and other forms of collaboration.
By calculating employees of each employment type, you'll be able to spot HR bottlenecks like over- and under-staffing, evaluate your bench strength, and more.
Recruitment is a starting point in your strategic workforce planning process. By bringing the right talents on board, you can accelerate your company’s growth and create a sustainable talent pool. A list of actionable recruitment metrics will come in handy.
Common employee demographics data includes:
Employee demographics is a quantitive metric so that you can use it for different tasks. For example, it allows you to evaluate talent potential in specific areas and discover diversity, equity, and inclusion gaps.
The metric lets you figure out the average time it takes to close one vacancy in the specified period: from the moment the application is received from your internal customer until the candidate accepts the offer.
Ideally, you should calculate the metric quarterly to track the dynamics and sum up your efforts at the end of the year. If you get a high average time-to-hire rate, it doesn't necessarily mean your recruiters aren't doing their job properly. The complexity of a vacancy could also affect the result. For example, you may work in a highly competitive field where the average time to hire is typically higher than in other industries.
When to measure: At least every quarter
How to measure: Number of days spent on closing a vacancy / Number of vacancies
This metric is pretty straightforward. It shows the number of suitable candidates that went through all interviews, ultimately decided to join your company, and accepted a job offer. This metric helps you gain insight into your talent pipeline and adjust the hiring policy if necessary. For example, you could answer the questions like:
"Why do candidates refuse a job offer?"
"What can we do to reduce the number of refusals?"
Let's say you've figured that you need to increase a sign-on bonus and introduce a flexible schedule to make your company more attractive for candidates. In this case, regular tracking of the offer acceptance rate helps you assess the result of your experiments and pivot further.
When to measure: Quarterly
How to measure: Number of made job offers / Number of accepted offers
It's one of the most popular strategic workforce planning metrics since it provides actionable insight into the financial side of recruitment. One of the most straightforward formulas to calculate the cost per hire is, to sum up all recruitment costs:
You can break down the cost per hire for each job title to get even more precise data.
When to measure: Quarterly
How to measure: Overall recruitment expenses / Number of closed vacancies
This metric helps you assess your employer's brand potential (how attractive you are to external hires) and detect bottlenecks with specific vacancies that don’t get much resonance among candidates.
In the perfect world, vacancies get enough exposure and inbound CVs from candidates. However, the reality is different, and recruitment teams often need to struggle for the right talent. That’s why a low number of applicants shouldn’t discourage you. In fact, this metric helps you find opportunities for improvement, for example, invest in your employer brand or company’s PR, increase the compensation level, and so on.
When to measure: Quarterly
How to measure: Number of applicants / Number of people hired for a position * 100
If you fill the positions with your internal employees, then you recruit internal hires. External hires, on the contrary, are the candidates that join your company from the outside.
A high internal hiring rate signalizes excellent internal talent mobility. That means your employees are trained and skilled enough to switch to another department or get promoted to a new position.
When to measure: Once per year
How to measure: Number of internal hires / Total headcount * 100
A high external hiring rate could signal low internal talent mobility. However, a high external hiring rate demonstrates the relative freshness of talents joining your company and your employer's brand potential that helps bring new talents on board.
When to measure: Once per year
How to measure: Number of external hires / Total headcount * 100
Organizations that put diversity, equity, and inclusion as the cornerstone of their workforce planning strategy, are more profitable and customer-oriented than their less diverse competitors. To get the most out of your DEI efforts, embrace the metrics below.
To measure diversity percentage, you need to define your diversity characteristics first. For example, you can break down your diversity pool into age, gender, race, ethnicity, mental and physical abilities, sexual orientation, religion, military service, and more. Be aware, though, that some characteristics like sexual orientation are sensitive and require a genuinely trustful environment to share them.
You can measure diversity percentage by the total number of diverse employees or every single characteristic. The latter option allows you to derive more valuable data for more intelligent recruitment planning and employee retention strategies.
When to measure: Once per year
How to measure: Number of diverse employees / Total headcount * 100
Recent research shows that diverse management can boost a company’s revenue by 19%. This metric is similar to the previous one. However, it’s more precise as it measures the diversity percentage across management and C-level positions.
When to measure: Once per year
How to measure: Number of diverse employees in management positions / Total headcount * 100
Unfortunately, a gender pay gap is tangible even in developed countries with high DEI standards and local regulations. For instance, a Pew Research Center found that US women earned 84% of men's earnings in 2020.
When to measure: Once per year
How to measure: There are two ways to calculate the gender pay gap: mean difference and median difference.
To calculate the mean difference in gender pay, you need to sum up all individual male employee’s wages or hourly rates (MW) and sum up all individual female employee’s wages or hourly rates (FW).
The final formula is: MW – FW / MW * 100
For a median difference in gender pay: list all the lowest, median, and highest points in female and male wages (or hourly rates).
Median male wages – Median female wages / Median male wages * 100
A recent study of more than 1.8 million employees worldwide shows a strong correlation between employee well-being and company profits. Metrics that measure the level of employee happiness and well-being will help you in long-term strategic workforce planning.
There are many ways to check your employee happiness rate. These techniques include surveys and anonymous questionnaires to check in with your colleagues and elicit answers on their well-being. Here’s how you can track the employee happiness rate:
The eNPS means Employee Net Promoter Score. This metric is detrimental to your strategic workforce planning campaign. It determines how likely your employees are to recommend your company to other people and how loyal they are. The eNPS questionnaire contains one simple question: "From 0 to 10, how likely are you to recommend our company as a place of work to friends and acquaintances?"
Then you need to calculate the grades from employees. Here's a breakdown of grades:
9-10 are promoters, the most loyal and enthusiastic employees;
7-8 are neutrals who are fine, but they will readily consider job offers;
0-6 are detractors who are likely to be in an active job search.
When to measure: At least every six months
How to measure: Number of promoters – number of detractors / Overall number of respondents
This metric allows you to assess the level of comfort and satisfaction of employees in the company. It's proven happy employees – both materially and psychologically – are more dedicated to their work.
HR managers use anonymous surveys that ask employees to give positive statements about the working conditions to measure job satisfaction. Typically, the surveys rely on the Likert scale, where 1 point means a complete disagreement with the statement, and 5 expresses a strong agreement. Then you can calculate the average score.
To get more insights, we recommend analyzing each question separately. You could discover that some statements get the most 1 and 2 scores, while other statements get only fives. Remember that figures not only affect the final score but also signal that something is going wrong in your office, and it's time to take action.
When to measure: Once in six months
How to measure: Overall number of scores / overall number of questions in a survey
87% of millennials believe that learning in the workplace is important. It’s a proven fact that training and development are workable methods of employee engagement and retention. In this section, we’ll review the vital L&D metrics and their impact on skills development.
This metric shows the average sum of money a company spends on training an employee. You can enhance this metric and calculate the costs of developing hard and soft skills or break down the costs by a job title.
When to measure: Once per year
How to measure: Overall sum of training expenses / Number of employees
The training completion rate represents the average number of employees that completed training. Organizations strive for the highest figure possible which indicates high employee engagement in the company's L&D initiatives and future-proof orientation.
When to measure: Once per year
How to measure: Number of employees who received training / Total headcount * 100
Everyone is studying at their own pace. This metric shows the average time spent to complete training. There's no specific benchmark for this metric. Track this metric regularly to ensure consistency in average training time and high completion rate.
When to measure: Once a year
How to measure: Total training hours for all employees / Total headcount
According to the 24x7 Learning report, only 12% of learners apply the skills they learned in their regular job. That’s why organizations are struggling to facilitate knowledge transfer and the adoption of skills gained through training.
Here’s who to assess the training efficiency:
What are strategic workforce planning metrics, and why are they important?
Strategic workforce planning metrics are key indicators that help organizations measure the effectiveness of their workforce planning strategies, ensuring alignment with business goals and enabling informed decision-making regarding talent management.
Which metrics are crucial for successful workforce planning?
Crucial metrics include turnover rates, time-to-fill positions, employee productivity rates, cost-per-hire, and the ratio of internal to external hires, among others, depending on the specific goals and needs of the organization.
How do these metrics influence workforce planning decisions?
These metrics provide insights into the current and future needs of the workforce, help identify gaps in skills or staffing, inform recruitment and retention strategies, and measure the success of initiatives aimed at improving workforce effectiveness.
Can workforce planning metrics be applied to all industries?
While the concept of workforce planning metrics is universally applicable, the specific metrics used may vary based on industry, company size, and other factors, requiring customization to ensure relevance and accuracy.
What are the best practices for monitoring and analyzing these metrics?
Best practices include establishing clear metrics relevant to business objectives, ensuring accurate and consistent data collection, regularly reviewing and analyzing the data to identify trends, and using the insights gained to drive strategic decision-making.